
Debugging .NET Native in Visual Studio
.NET Native is a bit of a different animal. The Xamarin forums and Stack Overflow have lots of questions related to issues stemming from this. The big difference being that in Release mode, Visual Studio compiles your app using the .NET Native tool chain. We’ve seen that this can often cause late-in-the-dev-cycle runtime issues that pop up when a Release build is performed.
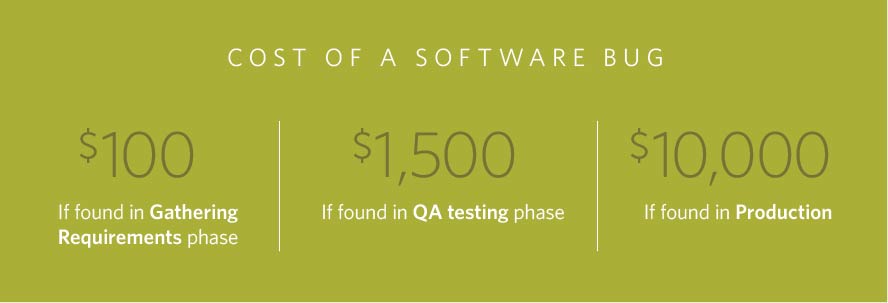
The further along a bug gets in the development cycle, the more expensive it is, so I’d encourage you to regularly test a Release build on UWP, or better yet, have your CI Process produce a Release build of your UWP app for testing before the app even has a chance to make it into further environments like QA or Production.
From MSDN:
If you run into an issue when testing the Release configuration that you need to debug it is important to note that the Release configuration is by default fully optimized code (e.g. code inlining will be applied in many places). These optimizations will have a significant impact on the debugging experience including unpredictable stepping and breakpoint behavior (due to code inlining) and the inability to inspect most variables due to memory optimizations. This means you will want to debug a non-optimized .NET Native build.
The easiest way to do this is to create a new build configuration with code optimization disabled, that way you can simply switch over to this new configuration when you need to debug a .NET Native build.
Here’s how to do that in Visual Studio:
- In VS, go to the Solution Configurations dropdown and select Configuration Manager.
- In the Active solution configuration dropdown, select the <New… option
- Name this new configuration “Debug .NET Native” or something like that.
- Copy settings from Debug, click OK. (Don’t use settings from the Release configuration)
- You’ll now see your new configuration in the config manager screen, but before you close this, make sure to check the Build and Deploy checkboxes for the UWP head project. They’re unchecked by default (I don’t understand why)
Then go to the Project Properties of your .UWP head project. You’ll need to toggle 2 boxes here:
- Uncheck Optimize code
- Check the Compile with .NET Native tool chain
Tips
-
One downside of using the .NET Native tool chain is that it takes quite a bit longer for your Solution to build, so don’t be concerned when you see that.
-
Sometimes issues with .NET Native compilation can be found at compile time. I’ve had some success using the Microsoft.NETNative.Analyzer NuGet package as suggested by MS to find these. It might be worth the quick NuGet download to try it out if you’re having runtime issues.
Issues
- The first time I did this, I copied settings from the Release configuration instead of Debug and ran into issues debugging:
- The debugger would not hit (stop at) my breakpoints in the code
- Often saw a “[Your App Name].UWP.pdb not loaded” screen when debugging
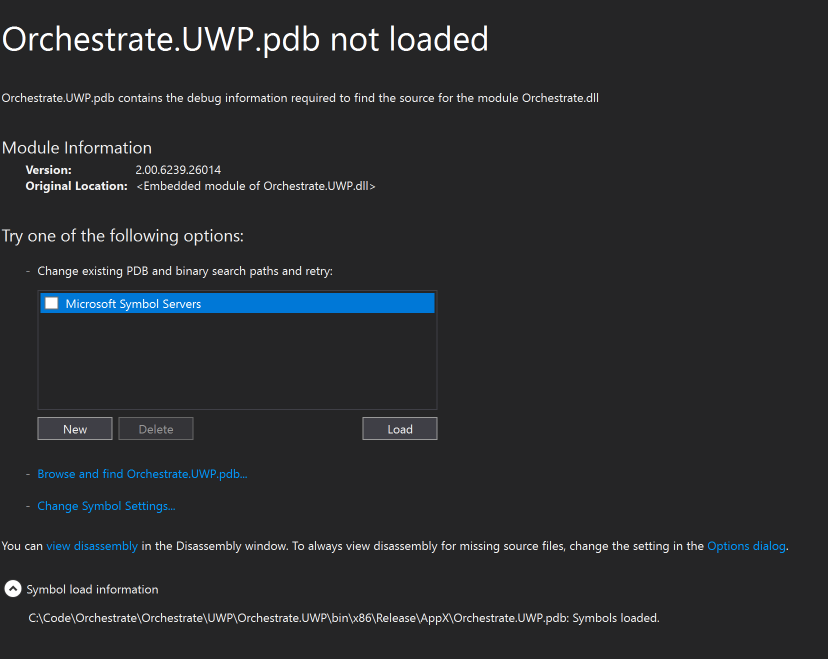
As far as I can tell, a Release build doesn’t produce the necessary symbol files (pdb) for your app DLL and this was the issue here.
Resources
I hesitate to share this link because it hasn’t been updated since July 2015, but this is how I learned how to do this. Please hit me up if you find a better/newer source.
